2023 Study - Results and Resources
The 2023 Urban Tree Canopy Assessment and Change Analyis study is a continuation of efforts by the City of Atlanta to better understand its ever changing urban tree canopy. 2023 study results are summarized through our online apps and Story Maps. Click an image below to go directly to one of the 2023 Atlanta UTC Study applications.
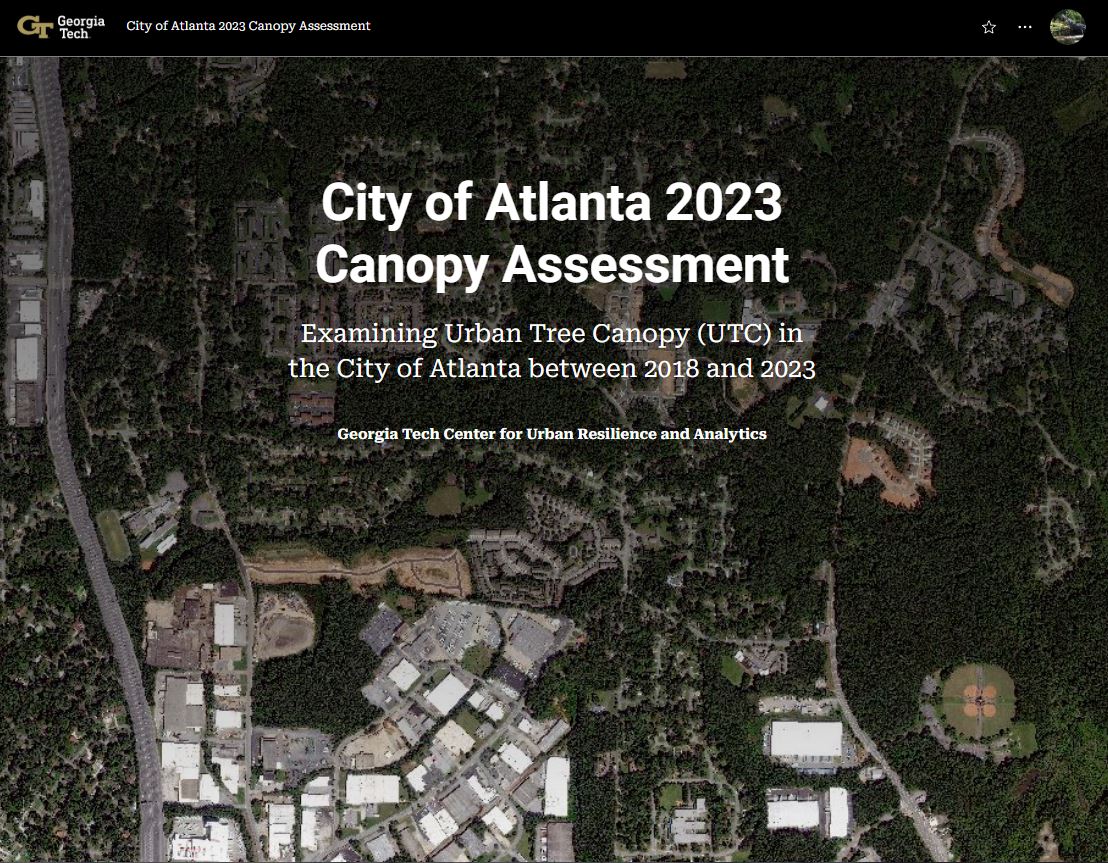
2023 Urban Tree Canopy Story Map
This guided presentation showcases the history, methods and results of 2023 Atlanta Urban Tree Canopy Assessment and Change Analysis. Walk yourself through the project and read about Atlanta's urban tree canopy changes between 2018 and 2023. See statistics and metrics for the 2023 Urban Tree Canopy in the City of Atlanta, with discussions regarding the implications of land cover and canopy change between 2018 - 2023.
Highlights include canopy change photos taken on site, interactive maps showing 2023 canopy and 2018-2023 canopy change statistics by local area, and links to data dashboards showing tree-based ecosystem benefits across the city.
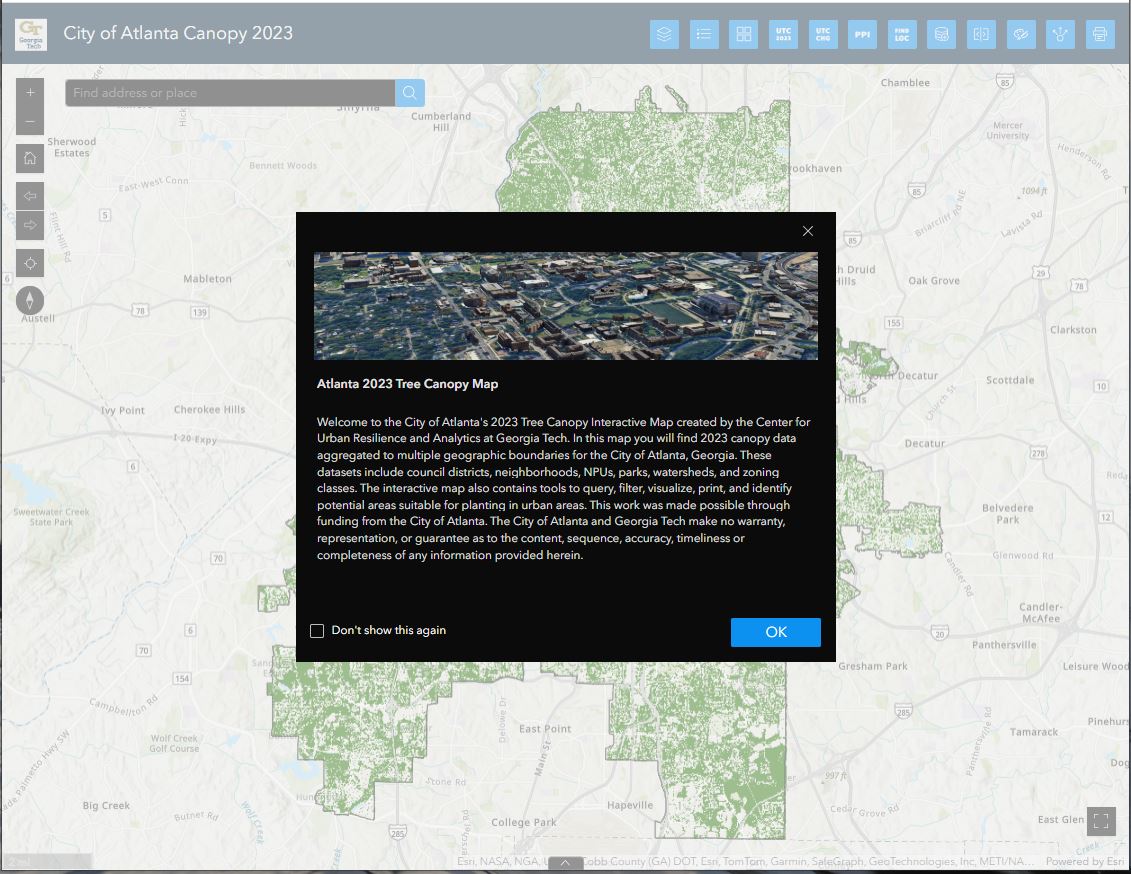
Interactive 2023 Urban Tree Canopy Map
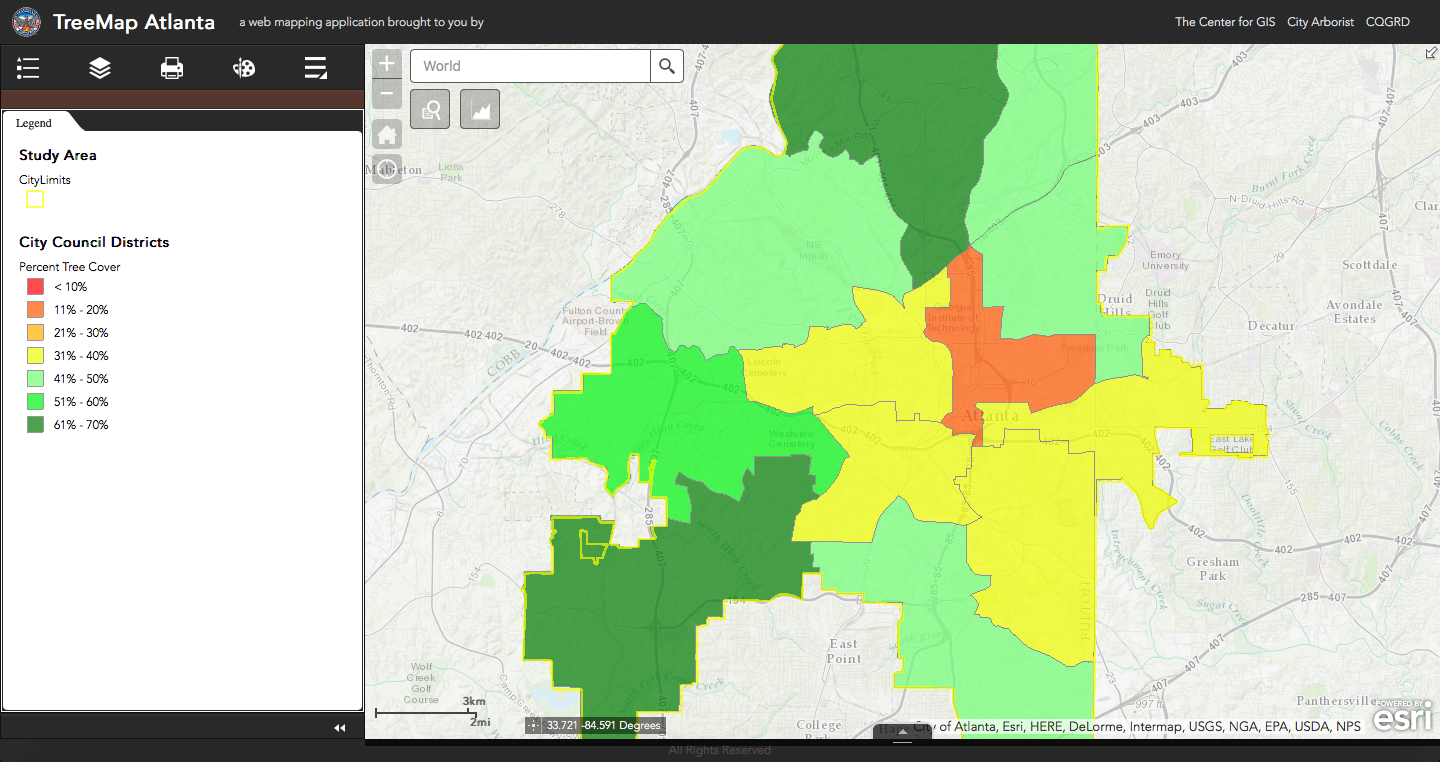
Dive further into the data with this interactive mapping application. Datasets developed from 2018 and 2023 canopy studies are linked to common geographic boundaries like neighborhoods and council districts. Search your area of interest for 2023 and/or 2018-2023 canopy values, create canopy charts, view 2018 ecosystem benefit estimates, or simplay take a closer look at the satellite imagery from which the canopy layers were derived.
Start exploring City of Atlanta 2023 canopy data here – view 2023 and 2018-2023 canopy values for your area of interest, view different basemaps, add you own data to the map. Even print your own map as a PDF for easy sharing.
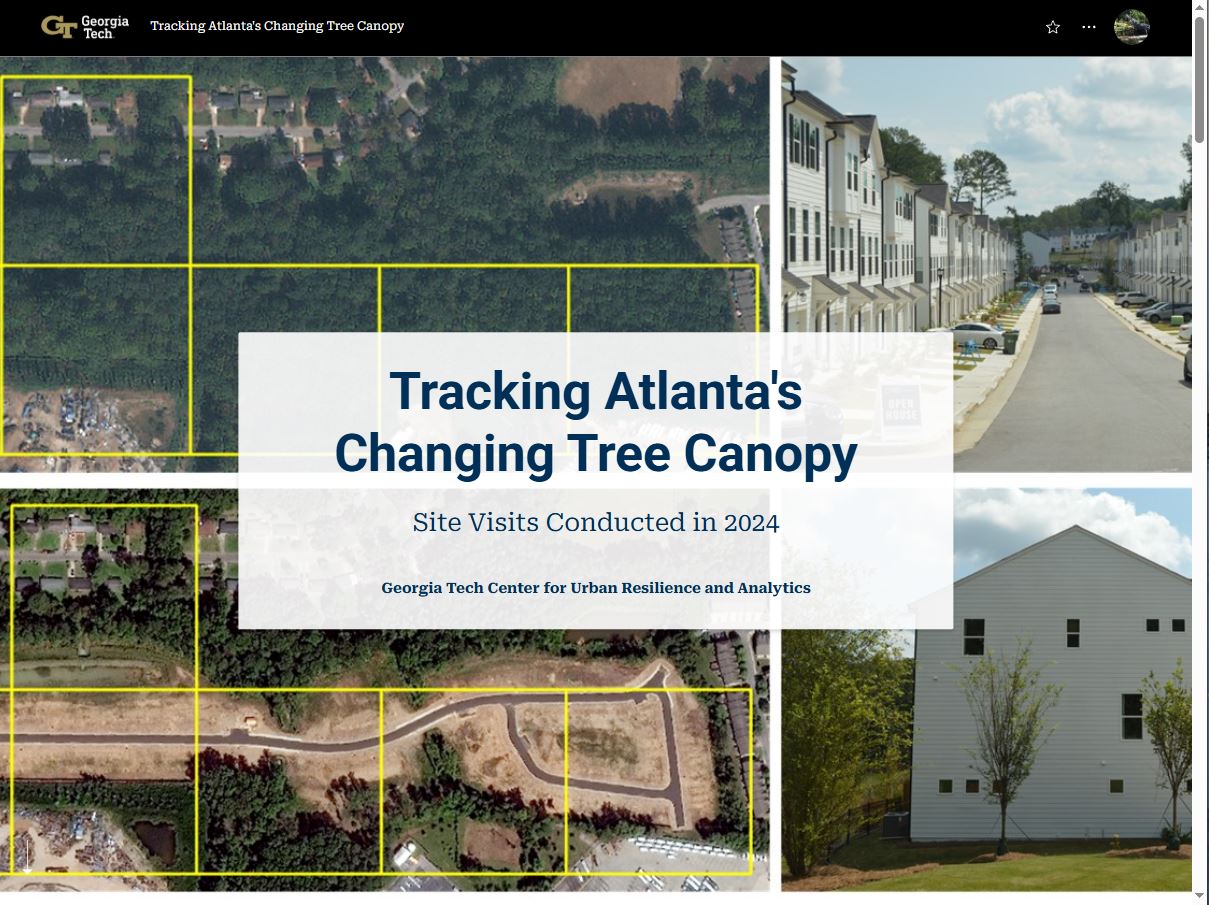
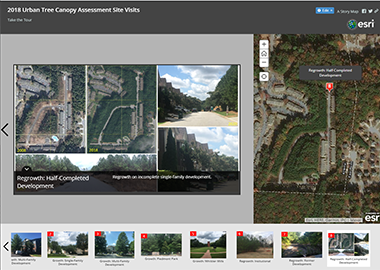
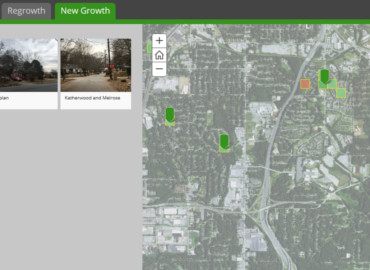
2023 Site Visit Explorer
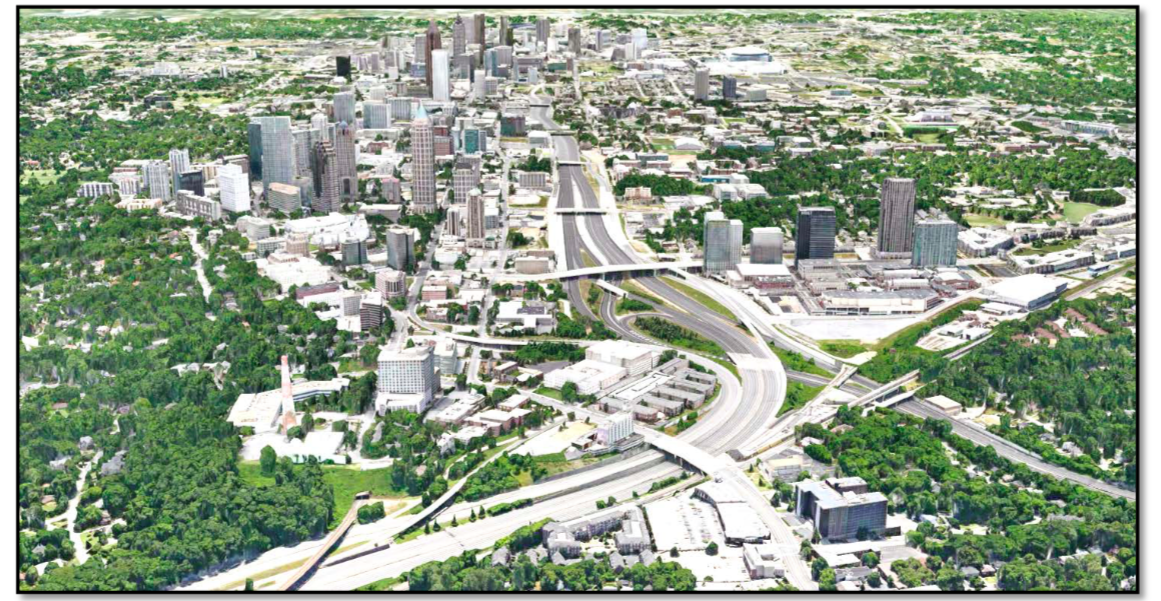
Part of the data-validation process used for the 2023 tree canopy update involved field verification of changes identified in the satellite imagery. The research team visited over 100 locations throughout the city to confirm trends and changes identified during the analysis – this application showcases some of the areas displaying the most drastic change since 2018.
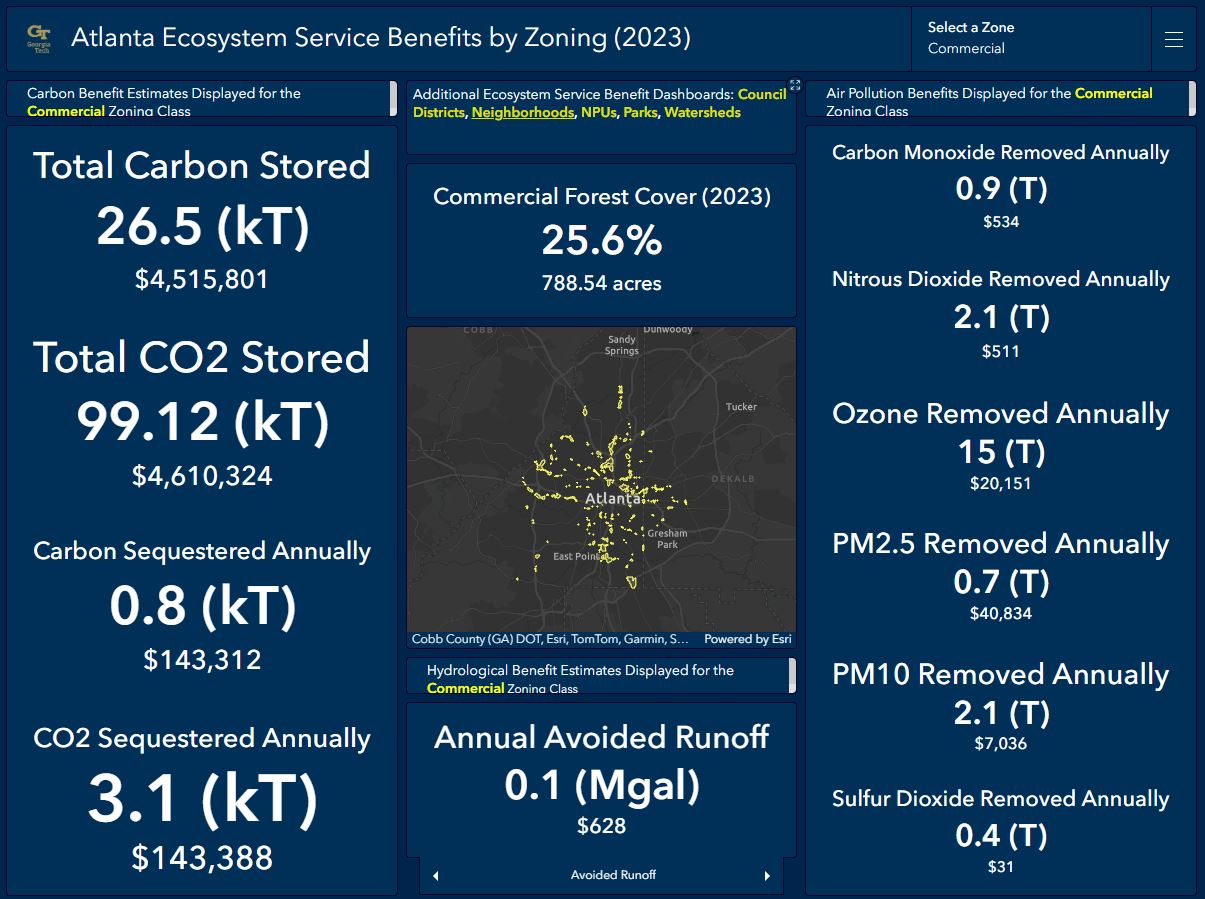
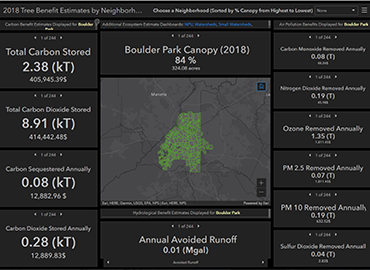
Ecosystem Services Dashboards
Using conversion factors developed by the USDA Forest Service and available through their online tool, I-Tree Canopy, the project team calculated estimates of Atlanta's carbon, air pollution and hydrological ecosystem service benefits provided by the city's urban tree canopy. The results of these 2023 ecosystem service benefit estimates ae presented in an ESRI data dashboard.
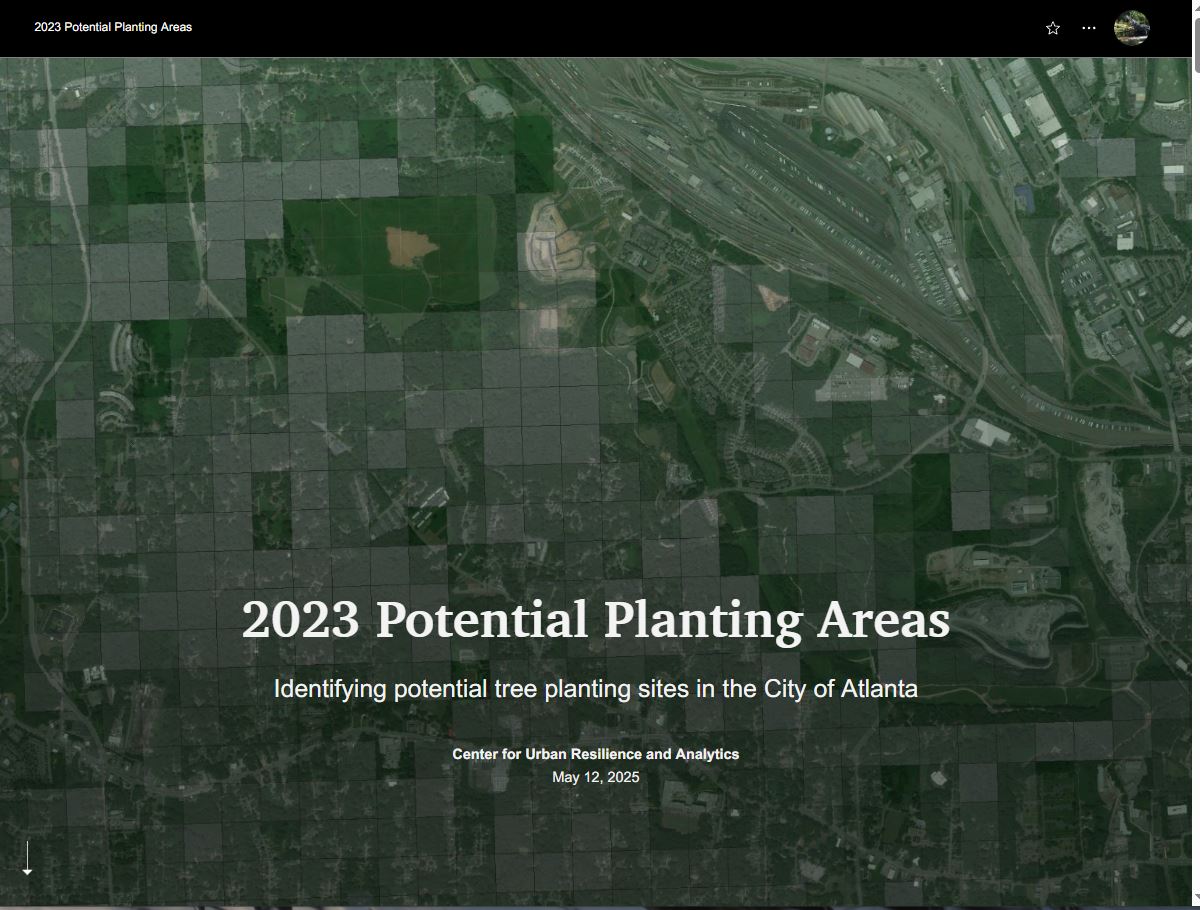
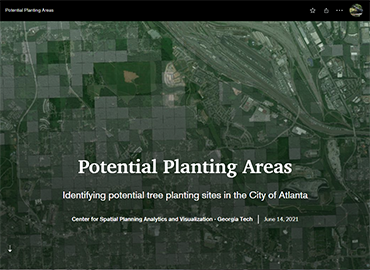
Potential Planting StoryMap
This StoryMap provides resources to identify potential planting sites across the city. Using results from 2023 urban tree canopy assessment, the project team developed a Potential Planting Index that ranks areas of the city based on the ratio of urban tree canopy to non-tree vegetation. Areas with less canopy and more non-tree vegetation can potentially serves as tree planting sites. Resources linked within this Story Map provide guides for quickly assessing areas of the city for tree planting.
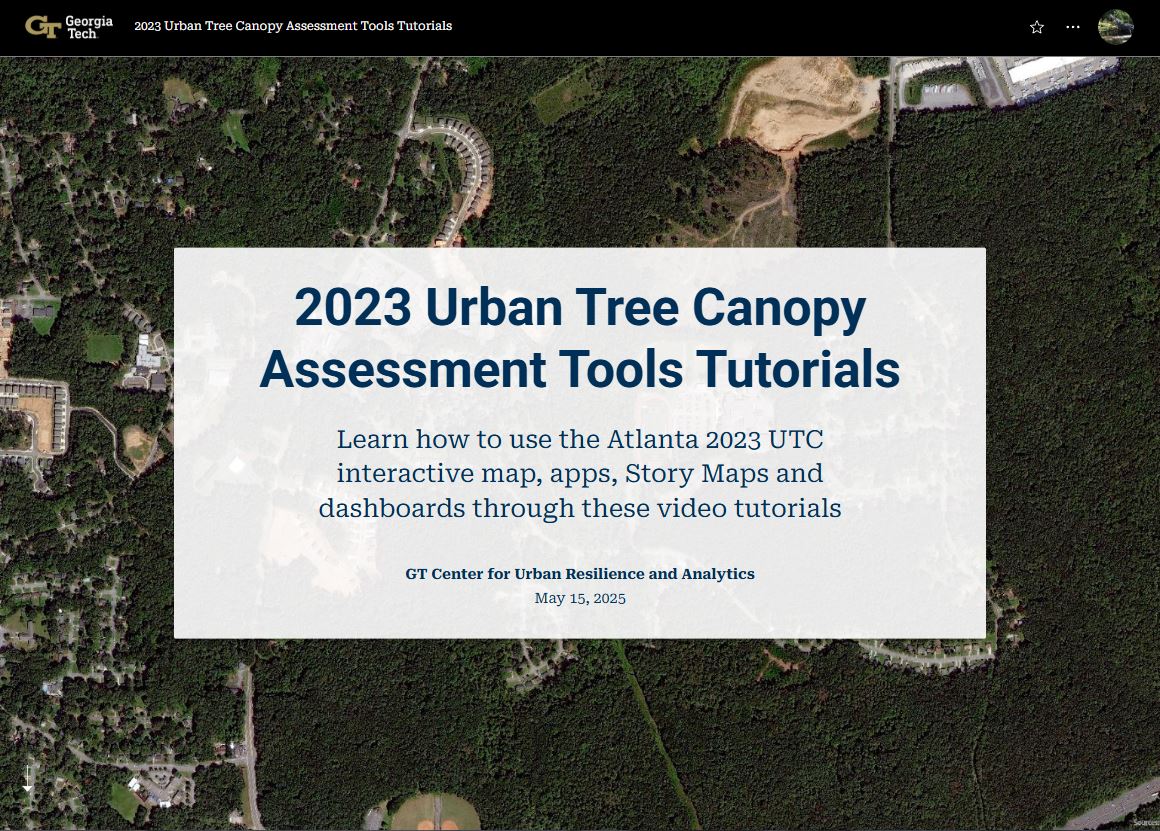
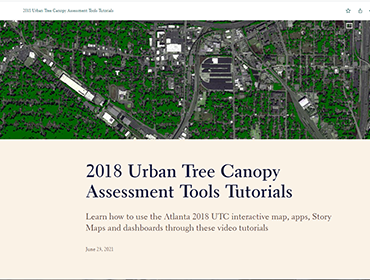
Canopy Assessment Tools Tutorials
This Story Map provides links to video tutorials for each of the 2023 web mapping applications. Learn how to run queries, create charts, and make personalized maps in the 2023 UTC Interactive Map. Learn how to view pictures from 2023 site visits and examine canopy change between 2018 - 2023 using the Site Vists StoryMap. Also explore out the videos on the Potential Planting Index and 2023 Ecosystem Benefit Estimates Dashboard.
2023 Final Report
This report provides a comprehensive analysis of the 4th City of Atlanta Urban Tree Canopy study and includes 2023 urban tree canopy assessment results and canopy change analysis between 2018 - 2023. Most geographic sections of the report (neighborhoods, NPUs, council districts, parks, watersheds, and zoning) can be read independently without loss of information.
2018 Study - Results and Resources
The 2018 Urban Tree Canopy Assessment and Change Analyis study is a continuation of efforts by the City of Atlanta to better understand its ever changing urban tree canopy. 2018 study results are summarized through our online apps and Story Maps. Click an image below to go directly to one of the 2018 Atlanta UTC Study applications.
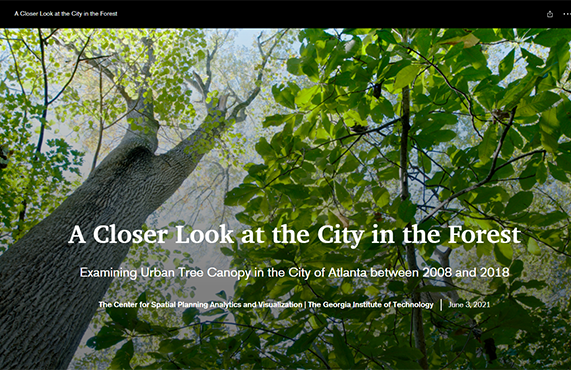
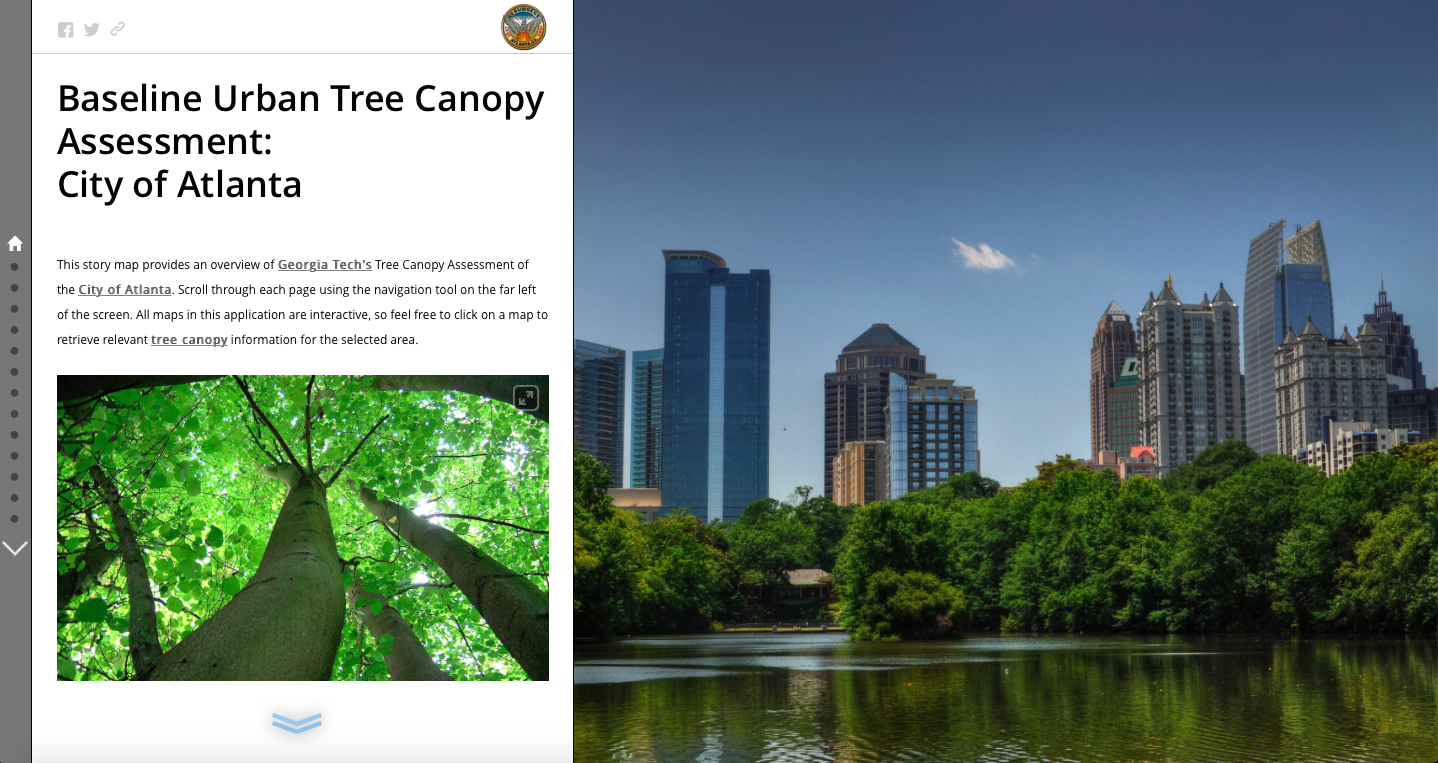
City of Atlanta 2018 Urban Tree Canopy Story Map
This guided presentation showcases the history, methods and results of 2018 Atlanta Urban Tree Canopy Assessment and Change Analysis. Walk yourself through the project and read about Atlanta's urban tree canopy changes between 2008 and 2018. See statistics and metrics for the 2018 Urban Tree Canopy in the City of Atlanta, with discussions regarding the implications of land cover and canopy change between 2008 - 2018.
Highlights include canopy change photos taken on site, interactive maps showing 2018 canopy and 2008-2018 canopy change statistics by local area, and links to data dashboards showing tree-based ecosystem benefits across the city.
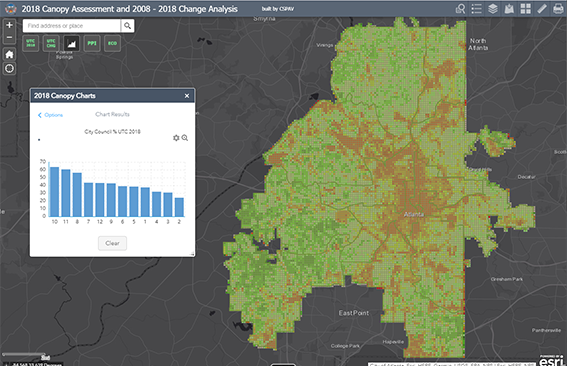
Interactive 2018 Urban Tree Canopy Map App
Dive further into the data with this interactive mapping application. Datasets developed from 2008 and 2018 canopy studies are linked to common geographic boundaries like neighborhoods and council districts. Search your area of interest for 2018 and/or 2008-2018 canopy values, create canopy charts, view 2018 ecosystem benefit estimates, or simplay take a closer look at the satellite imagery from which the canopy layers were derived.
Start exploring City of Atlanta 2018 canopy data here – view 2018 and 2008-2018 canopy values for your area of interest, view different basemaps, add you own data to the map. Even print your own map as a PDF for easy sharing.
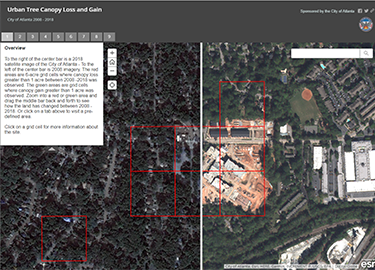
2008 - 2018 Canopy Change Viewer
Explore selected areas in Atlanta that have lost or gained more than 1 acre in canopy between 2008-2018. Using a "Swipe" application, viewers can overlay 2018 satellite imagery with 2008 imagery to view canopy changes across the city. This mapping application highlights how quickly growth and loss of canopy occurs in the city.
2018 Site Visit Explorer
Part of the data-validation process used for the 2018 tree canopy update involves field verification of changes identified in the satellite imagery. The research team visited over 100 locations throughout the city to confirm trends and changes identified during the analysis – this application showcases some of the areas displaying the most drastic change since 2008.
Ecosystem Services Dashboards
Using conversion factors developed by the USDA Forest Service and available through their online tool, I-Tree Canopy, the project team calculated estimates of Atlanta's carbon, air pollution and hydrological ecosystem service benefits provided by the city's urban tree canopy. The results of these 2018 ecosystem service benefit estimates ae presented in an ESRI data dashboard.
Potential Planting Story Map and Resources
This Story Map provides resources to identify potential planting sites across the city. Using results from 2018 urban tree canopy assessment, the project team developed a Potential Planting Index that ranks areas of the city based on the ratio of urban tree canopy to non-tree vegetation. Areas with less canopy and more non-tree vegetation can potentially serves as tree planting sites. Resources linked within this Story Map provide guides for quickly assessing areas of the city for tree planting.
Canopy Assessment Tools Tutorials
This Story Map provides links to video tutorials for each of the 2018 web mapping applications. Learn how to run queries, create charts, and make personalized maps in the 2018 UTC Interactive Map. Learn how to view pictures from 2018 site visits and examine canopy change between 2008 - 2018 using the Site Vists and Canopy Change Story Maps. Check out the videos on the Potential Planting Index and 2018 Ecosystem Benefit Estimates Dashboard.
2018 Final Report
This report provides a comprehensive analysis of the 3rd City of Atlanta Urban Tree Canopy study and includes 2018 urban tree canopy assessment results and canopy change analysis between 2008 - 2018. Most geographic sections of the report (neighborhoods, NPUs, council districts, parks, watersheds, and zoning) can be read independently without loss of information.
2014 Study - Results and Resources
Continued efforts from the project team focused on analyzing canopy change reveal trends and patterns in the loss and gain of Atlanta’s Urban Tree Canopy (UTC). Results are summarized through our online apps and story maps. Click an image below to go directly to one of the 2014 Atlanta UTC Study applications.
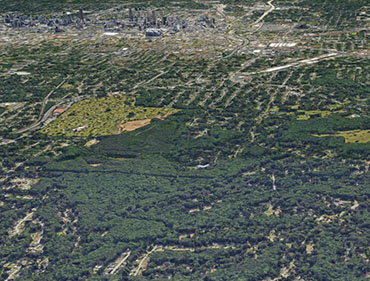
Atlanta 2014 UTC Story Map
This guided presentation showcases the history and methods of Atlanta tree canopy classification. Step through the project timeline and read about the results of comparing imagery from 2008 and 2014. See statistics and metrics for the Urban Tree Canopy in the City of Atlanta, with discussions regarding the implications of land cover and canopy change.
Highlights include an overview of the land cover classification process using satellite imagery, from raw imagery to classification and finally aggregation to cell study areas and other geographic boundaries.
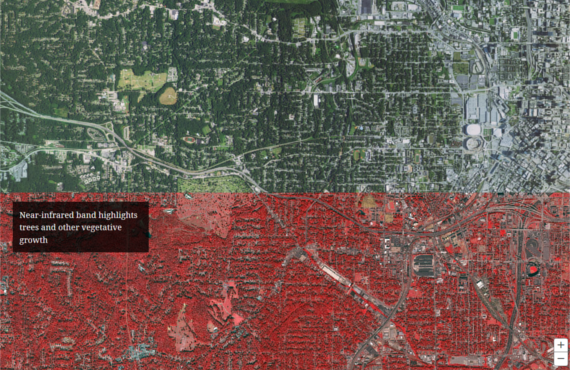
Interactive 2014 UTC App
After learning about the history and process of the Atlanta Urban Tree Canopy project, dive further into the data with this useful mapping application. Datasets developed from 2008 and 2014 classified canopy studies are linked to common geographic boundaries like neighborhoods and council districts. Filter through data layers, create charts and graphs of canopy cover values, or take a closer look at the raw imagery.
Start exploring Atlanta canopy data here – change visible layers, filter results, view different basemaps, and add you own data to the map. Results can be saved to PDF for easy sharing.
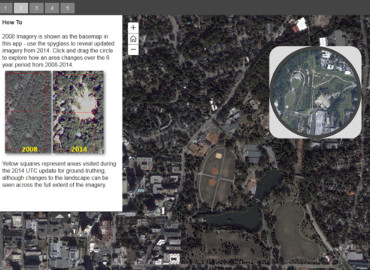
Canopy Change Viewer (08-14)
Read about some key points of the Atlanta UTC project before exploring satellite imagery to detect changes to the landscape. Imagery from 2008 serves as the basemap, with a spyglass viewer revealing the 2014 land cover. Finished with a brief summary of the 2008-2014 change analysis, this mapping application highlights how quickly both grown of canopy and development of land occurs in the city.
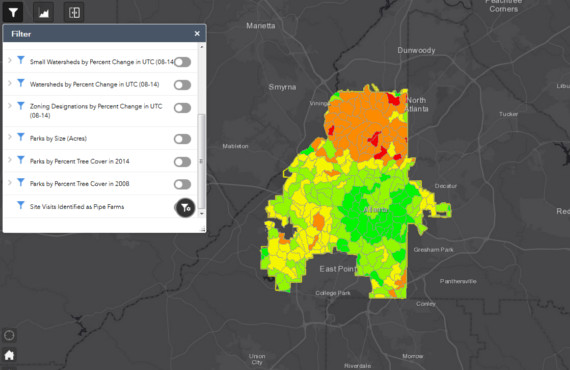
Site Visit Explorer 2014
Part of the data-validation process used for the 2014 tree canopy update involves boots-on-the-ground verification of changes identified in the satellite imagery. The research team visited 150 locations throughout the city to confirm trends and changes identified during the analysis – this application showcases some of the areas displaying the most drastic change since 2008.
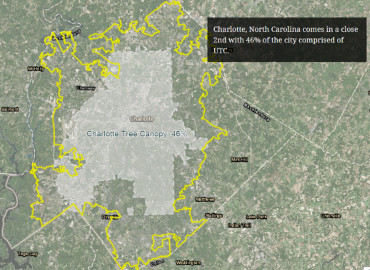
City Canopy Comparison
Results from the 2008 Urban Tree Canopy Analysis placed Atlanta at the top of the list for canopy cover for similarly sized urbanized cities – the lush ecosystem and mixture of hard and softwoods native in the southeast contribute to Atlanta’s extraordinary canopy cover. Atlanta’s city limits are superimposed over other select cities to show landscape and canopy variation in this map application.
2008 Study - Results and Resources
Researches at Georgia Tech have studied greenspace in the City of Atlanta since 1999. The first city-wide tree canopy study used imagery from 2008 to draw conclusions about the state of the Urban Tree Canopy (UTC) in Atlanta. Click an image below to learn more about the first UTC study.
2008 UTC Assessment Final Report
This report provides a comprehensive analysis of the original Urban Tree Canopy study - from introducing the benefits of urban trees to pinpointing target areas for planting more trees.
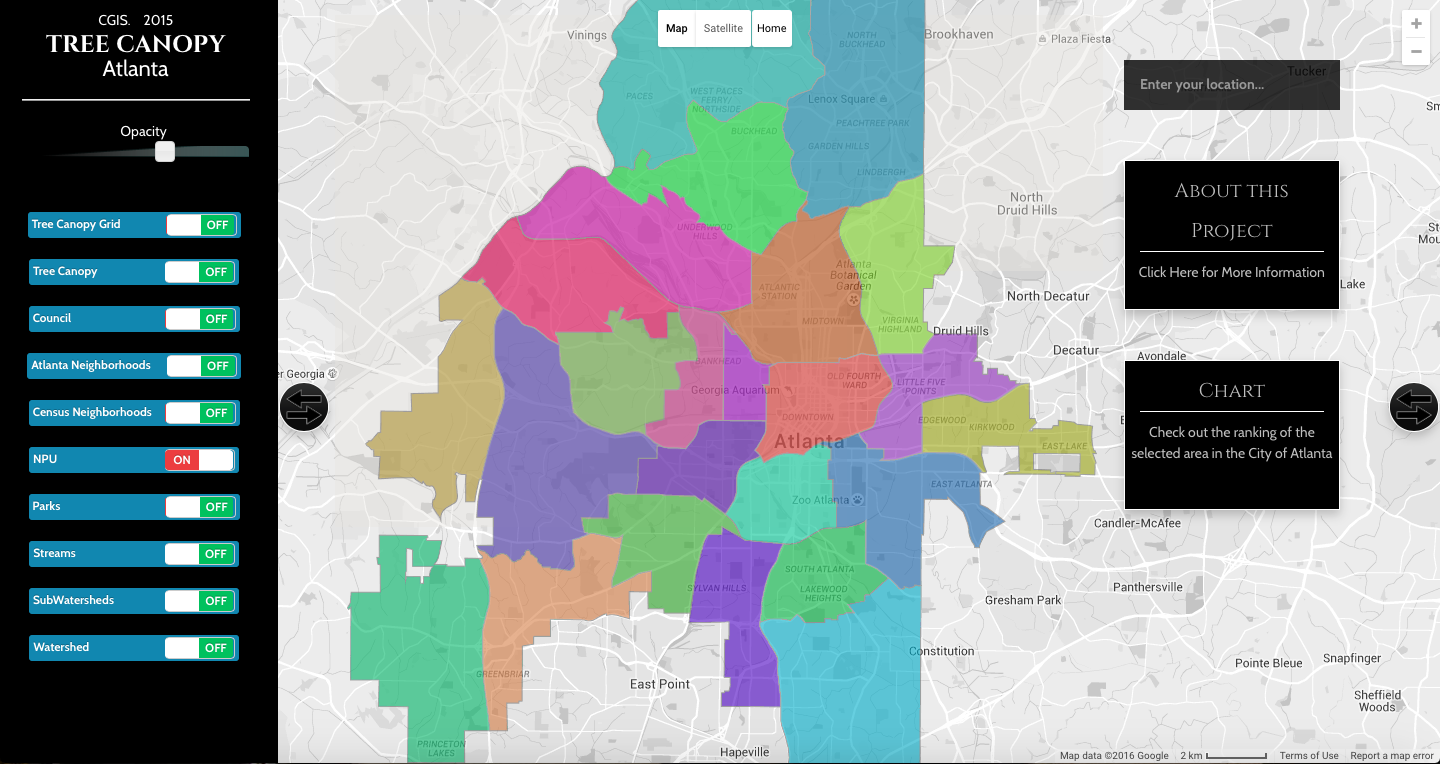
2008 Urban Tree Canopy Interactive Map
This map shows all the layers associated with evaluating Atlanta's tree canopy, including Urban Tree Cover, Watersheds, Atlanta Neighborhoods, City Council Districts, and much more!